 TireGeoCalc
Speedometer Error Chart by Tire Size
Quick answer
Nominal geometryTable example: 225/45R17 → 225/50R17 · original-size calibration assumed
- 225/50R17 diameter
- 25.86in
- Diameter change
- +3.55%
- Actual at indicated 60 mph
- 62.13mph
Calculated from size markings. Not measured rolling dimensions or vehicle fitment approval.
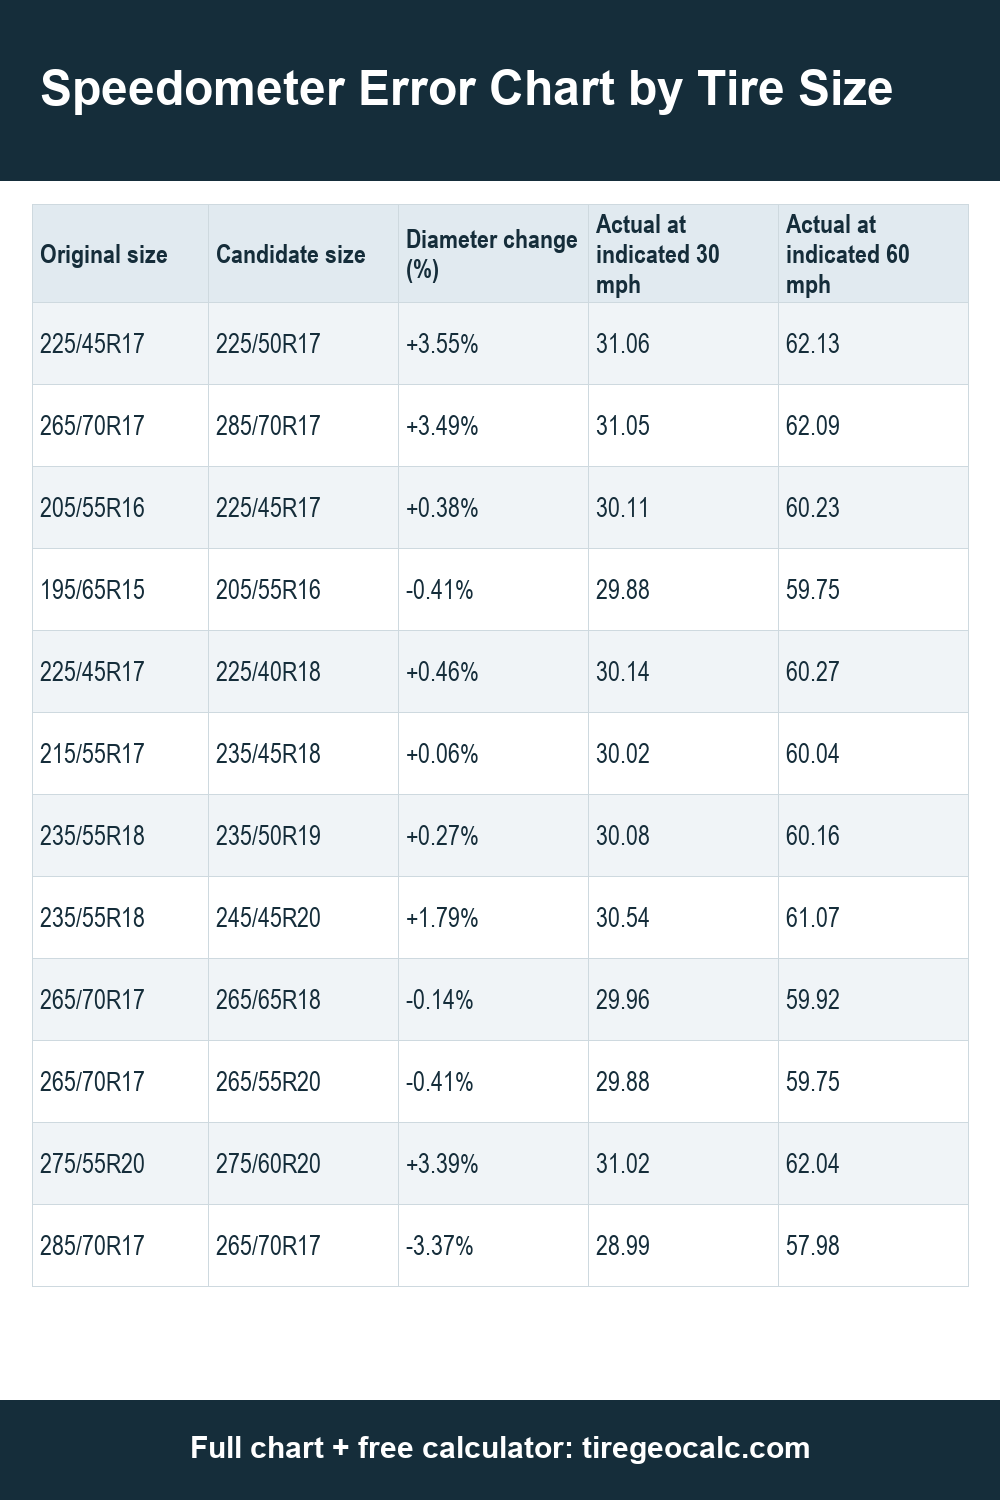
See calculated actual speeds at indicated 30 and 60 mph for common tire size changes. The chart assumes that the speedometer was calibrated exactly to the original tire, with no other instrument error. It compares nominal tire geometry rather than measuring a vehicle on the road. Read each row from original to candidate, because reversing those sizes changes the ratio and the percentage denominator. These are nominal geometric calculations, not vehicle fitment approval. Check the vehicle manual and exact tire and wheel specifications, including load and speed ratings, approved rim width and clearance; consult the manual for any diameter change exceeding 3%.
Speedometer Error Chart by Tire Size: calculated chart
Original and candidate are complete tire sizes. The two speed columns show actual mph at the indicated speeds in their headings. Positive diameter change means a taller candidate. Values are calculated before rounding.
| Original size | Candidate size | Diameter change (%) | Actual at indicated 30 mph | Actual at indicated 60 mph |
|---|---|---|---|---|
| 225/45R17 | 225/50R17 | +3.55% | 31.06 | 62.13 |
| 265/70R17 | 285/70R17 | +3.49% | 31.05 | 62.09 |
| 205/55R16 | 225/45R17 | +0.38% | 30.11 | 60.23 |
| 195/65R15 | 205/55R16 | -0.41% | 29.88 | 59.75 |
| 225/45R17 | 225/40R18 | +0.46% | 30.14 | 60.27 |
| 215/55R17 | 235/45R18 | +0.06% | 30.02 | 60.04 |
| 235/55R18 | 235/50R19 | +0.27% | 30.08 | 60.16 |
| 235/55R18 | 245/45R20 | +1.79% | 30.54 | 61.07 |
| 265/70R17 | 265/65R18 | -0.14% | 29.96 | 59.92 |
| 265/70R17 | 265/55R20 | -0.41% | 29.88 | 59.75 |
| 275/55R20 | 275/60R20 | +3.39% | 31.02 | 62.04 |
| 285/70R17 | 265/70R17 | -3.37% | 28.99 | 57.98 |
| 245/75R16 | 265/70R17 | +3.73% | 31.12 | 62.24 |
| 225/65R17 | 235/65R17 | +1.79% | 30.54 | 61.08 |
| 255/75R17 | 265/70R17 | -1.41% | 29.58 | 59.15 |
| 265/70R17 | 265/75R17 | +3.30% | 30.99 | 61.98 |
Original calibration assumed; calculated actual mph, not a measured instrument test.
- Original size
- 225/45R17
- Candidate size
- 225/50R17
- Diameter change (%)
- +3.55%
- Actual at indicated 30 mph
- 31.06
- Actual at indicated 60 mph
- 62.13
- Original size
- 265/70R17
- Candidate size
- 285/70R17
- Diameter change (%)
- +3.49%
- Actual at indicated 30 mph
- 31.05
- Actual at indicated 60 mph
- 62.09
- Original size
- 205/55R16
- Candidate size
- 225/45R17
- Diameter change (%)
- +0.38%
- Actual at indicated 30 mph
- 30.11
- Actual at indicated 60 mph
- 60.23
- Original size
- 195/65R15
- Candidate size
- 205/55R16
- Diameter change (%)
- -0.41%
- Actual at indicated 30 mph
- 29.88
- Actual at indicated 60 mph
- 59.75
- Original size
- 225/45R17
- Candidate size
- 225/40R18
- Diameter change (%)
- +0.46%
- Actual at indicated 30 mph
- 30.14
- Actual at indicated 60 mph
- 60.27
- Original size
- 215/55R17
- Candidate size
- 235/45R18
- Diameter change (%)
- +0.06%
- Actual at indicated 30 mph
- 30.02
- Actual at indicated 60 mph
- 60.04
- Original size
- 235/55R18
- Candidate size
- 235/50R19
- Diameter change (%)
- +0.27%
- Actual at indicated 30 mph
- 30.08
- Actual at indicated 60 mph
- 60.16
- Original size
- 235/55R18
- Candidate size
- 245/45R20
- Diameter change (%)
- +1.79%
- Actual at indicated 30 mph
- 30.54
- Actual at indicated 60 mph
- 61.07
- Original size
- 265/70R17
- Candidate size
- 265/65R18
- Diameter change (%)
- -0.14%
- Actual at indicated 30 mph
- 29.96
- Actual at indicated 60 mph
- 59.92
- Original size
- 265/70R17
- Candidate size
- 265/55R20
- Diameter change (%)
- -0.41%
- Actual at indicated 30 mph
- 29.88
- Actual at indicated 60 mph
- 59.75
- Original size
- 275/55R20
- Candidate size
- 275/60R20
- Diameter change (%)
- +3.39%
- Actual at indicated 30 mph
- 31.02
- Actual at indicated 60 mph
- 62.04
- Original size
- 285/70R17
- Candidate size
- 265/70R17
- Diameter change (%)
- -3.37%
- Actual at indicated 30 mph
- 28.99
- Actual at indicated 60 mph
- 57.98
- Original size
- 245/75R16
- Candidate size
- 265/70R17
- Diameter change (%)
- +3.73%
- Actual at indicated 30 mph
- 31.12
- Actual at indicated 60 mph
- 62.24
- Original size
- 225/65R17
- Candidate size
- 235/65R17
- Diameter change (%)
- +1.79%
- Actual at indicated 30 mph
- 30.54
- Actual at indicated 60 mph
- 61.08
- Original size
- 255/75R17
- Candidate size
- 265/70R17
- Diameter change (%)
- -1.41%
- Actual at indicated 30 mph
- 29.58
- Actual at indicated 60 mph
- 59.15
- Original size
- 265/70R17
- Candidate size
- 265/75R17
- Diameter change (%)
- +3.30%
- Actual at indicated 30 mph
- 30.99
- Actual at indicated 60 mph
- 61.98
Calculate actual speed from the diameter ratio
Actual speed equals indicated speed multiplied by candidate diameter divided by original diameter. Circumference gives the same ratio because pi cancels between the two circles. At an indicated 60 mph, a candidate that is exactly three percent taller produces a calculated actual speed of 61.8 mph. At an indicated 30 mph the same ratio gives 30.9 mph. Those examples illustrate the formula rather than a measured vehicle.
The tire engine calculates sidewall height from width and aspect ratio, adds both sidewalls to wheel diameter, then compares the two complete assemblies. All table values use that calculation without intermediate rounding. The displayed speeds have two decimal places for comparison; they do not imply that an actual dashboard instrument or tire dimension is accurate to a hundredth of a mile per hour.
Understand the direction of the error
With a taller tire, the speedometer reads lower than actual speed under the original-calibration assumption. The wheel covers more distance per revolution, while the instrument still interprets those revolutions using its original calibration. A shorter tire reverses that geometric effect: calculated actual speed is below indicated speed. Read the sign in the diameter-change column before interpreting either speed column.
For 265/70R17 to 285/70R17, width increases while aspect ratio and wheel diameter remain fixed. The sidewalls become taller, so actual speed increases at a given indication. The reverse row begins with 285/70R17 and produces a different percentage magnitude because its reference diameter is larger. These two rows demonstrate why simply changing the sign of a rounded forward percentage is not an exact reverse calculation.
Separate a chart estimate from speedometer compliance
In UK/EU requirements, a speedometer must not indicate less than actual speed. A tire-size calculation cannot establish compliance, even when the diameter difference is below three percent. Original instrument calibration may already include an over-read, and vehicle processing can affect the displayed speed. A positive tire-induced change could reduce that margin or lead to under-reading; the chart does not measure the original margin.
The three-percent diameter screen used in tire comparisons is a prompt to consult vehicle guidance, not a legal allowance for speedometer under-reading. Confirm the applicable vehicle specification and calibration procedure before adopting a different size. This page explains the nominal geometric contribution only. It cannot certify the instrument, authorize a replacement size or predict whether a vehicle requires electronic recalibration.
Use the original size and measured rolling data correctly
Start with the original specified tire size for the relevant axle. A size currently installed by a previous owner may not be the original calibration reference. Record the complete marking rather than just the wheel diameter. For staggered sizes or vehicles that use multiple wheel-speed signals, follow the vehicle documentation; a single diameter ratio does not model every control-system decision.
Nominal circumference is pi times unloaded geometric diameter. Actual rolling circumference depends on tire construction, wear, inflation and load, so manufacturer revolutions-per-mile data may differ. Compare like-for-like rolling specifications when available. The linked circumference chart explains those quantities, while the detailed speedometer guide shows the calculation step by step. Retain full precision until the final display and repeat the calculation if either complete tire code changes.
Frequently asked questions
Does a taller tire make the speedometer read low?
Yes under the original-calibration assumption used here: actual speed rises at the same indication. Existing factory over-read can change the final measured relationship, so the chart alone cannot tell you the observed dashboard error.
Why show both 30 and 60 mph?
The same diameter ratio applies at both indicated speeds in this model. The difference in mph doubles when indicated speed doubles. Displaying both helps distinguish a percentage change from a fixed speed offset.
Is a swap below three percent automatically legal?
No. A diameter screen is not approval, and it does not authorize under-reading. Check the vehicle documentation and applicable requirements using the exact tire and instrument specifications.
Can I calculate an unlisted pair?
Yes. Use the tire size calculator with your original and candidate codes. Compare the resulting diameter ratio and speed estimate, then check exact product rolling data and vehicle requirements separately.
Continue your comparison
These are nominal geometric calculations, not vehicle fitment approval. Check the vehicle manual and exact tire and wheel specifications, including load and speed ratings, approved rim width and clearance; consult the manual for any diameter change exceeding 3%.
Reference tables: Load index chart and Speed rating chart.